Testing times

figure 2: A hysteresis curve for Sitka spruce, showing the difference in moisture content at the same relative humidity depending on whether you are wetting or drying a sample (Jalaludin et al. 2009, J. Trop. For. Sci 22: 107
-
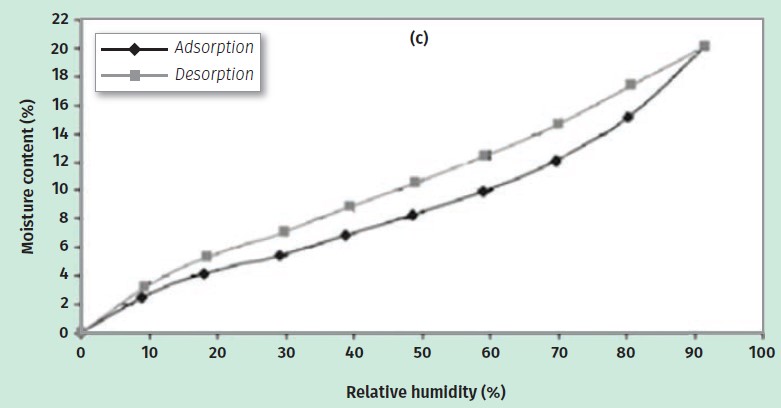
figure 2: A hysteresis curve for Sitka spruce, showing the difference in... -
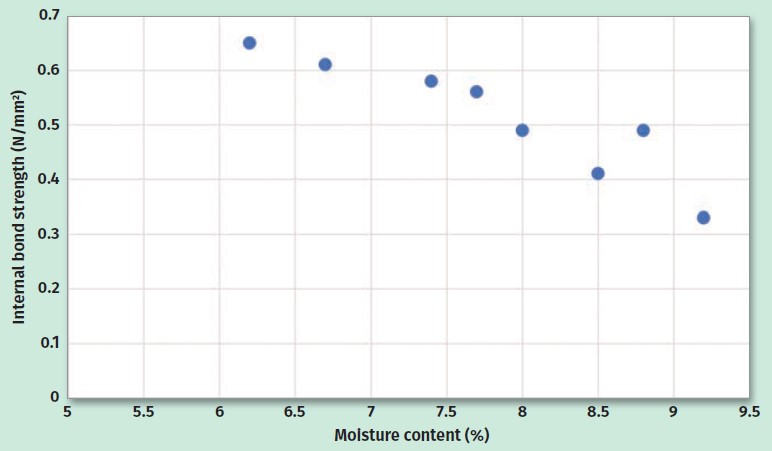
figure 1: Graph showing the reduction in internal bond strength with...