Producers struggling
9 November 2015Bernard Fuller of Cambridge Forest Products Associates says the Latin American countries are far from immune to the ills afflicting the global economy. Economic performance is generally disappointing in the region and the outlook doesn't hold a lot of promise.
Since 2012, global economic growth has been underwhelming and over the past year the outlook has become even less appealing as commodity markets collapse and China's economy slows further.
Clearly, these two factors are interconnected. The commodity super-cycle of the first decade of the 21st century was powered by China. But as China's transition from an investment-led to a consumer-led economy unwinds, then the demand for industrial commodities will at least decelerate and could drop significantly.
At the same time, the higher prices resulting from the commodity super-cycle unleashed investment in new capacity and this capacity is still coming on stream in lagged response to the commodity boom.
Declining demand (or at best very slow growth) for commodities in the face of increasing supplies has resulted in tumbling commodity prices. Oil trading at US$40 to 50 per barrel in mid-2015, compared to well over US$100 per barrel in early 2014 is just one example of the dramatic collapse in commodity pricing. Similar stories can be told for metals such as copper and iron.
While commodity purchasers and consumers benefit from these lower prices, commodity producing countries and regions experience slower economic growth, financial upheaval, budget crises and rising unemployment.
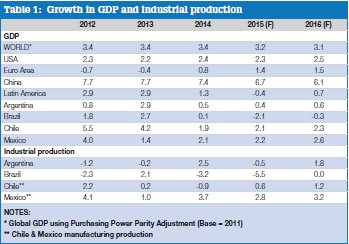
Global economic growth in the period 2012- 14 was flat, at 3.4% per year, as strengthening activity in the developed world (particularly Europe in 2014) was offset by weakening in the developing world (for example in Latin America, where overall growth slumped to 1.3% in 2014 from 2.9% in 2012-13, see Table 1).
Over the past several years, actual growth rates each year were generally lower than anticipated by the IMF and other prognosticators. Given the apparent weakness in China's economy in the first half of 2015, and the August 2015 turmoil in global stock and financial markets, the immediate prospects for the global economy are not encouraging and will likely result in further downward revisions in growth projections through at least 2016.
Economies: Forecasts
The weakness apparent in major economies such as China, Russia, Brazil and Japan will not be quickly remedied. Consequently, CFPA looks for slowing global economic growth in 2015-16 before some modest re-acceleration becomes evident by 2017 (possibly beginning as early as the second half of 2016). Global GDP growth is therefore forecast to slip to 3.2% in 2015 and 3.1% in 2016, rather than climbing as many forecasts have indicated.
Much hope has been placed on accelerating growth in the US to hold up (or boost) global economic expansion. However, an over-valued US dollar will act as a brake on US exports and industrial output, while weak income growth will stifle the hoped-for strong rebound in new home construction. US economic growth will do well to average 2.5% in 2016 but could be marginally higher. However, US growth of over 3% will be hard to achieve as long as much of the developing world struggles to first stabilise, and then grow, its economies.
China's economy in particular will experience further slowing GDP growth. From over 7% in 2012-14, China's annual GDP expansion will slow to 6% in 2016 (and could well drop as low as 4% on a quarterly basis).
Of course, China's published reports may not show such relatively low numbers, but the reality of slowing economic activity will be apparent in the levels of industrial and construction activity. For example, the housing sector in China still has an inventory correction to complete before the pace of new construction again picks up (not likely much before 2017).
With Brazil in recession, and Venezuela and Argentina in continued disarray (reported data from both countries are seldom credible), the whole of Latin America will likely record negative growth of -0.4% in 2015 and just a small positive (0.7%) in 2016. The projection for 2016 is dependent on Brazil growing again in the second half of the year; and on Mexico enjoying accelerating expansion.
Brazil's economy barely grew in 2014 (+0.1%) and is forecast to shrink by 2.1% in 2015. With political turmoil, corruption, hesitant economic reforms and under-investment in infrastructure, the medium-term prospects for Brazil are not rosy. This forecast assumes continued shrinkage in GDP through early 2016 before slow growth is recorded in the second half of the year.
For all of 2016, Brazil's economy is assumed to contract by another 0.3%. For panel producers, domestic market conditions therefore look grim until after mid-2016. However, the slump in Brazil's exchange rate has boosted exports, but exports alone will not shelter the domestic panel industry from an output decline in 2015.
While technically not in recession, Argentina's economy continues to wallow and, for all practical purposes, the economy was in recession in 2014 and the first half of 2015. It is unclear whether a new president, to be elected on October 25th, will shake up policy sufficiently to start solving the country's problems.
Argentina's exclusion from global financial markets limits investment in its resources and this holds back development and growth.
Weakness in Brazil will also hinder Argentina's exports. New political leadership could change the country's direction, but until a clearer read is available on the political situation in 2016 and beyond, we look for slow economic growth, at best, for Argentina, so wood panel markets are likely to be stagnant through 2016.
Chile remains one of the better-managed economies in South America. However, even here, growth has slumped along with commodity markets (in this case the plunge in copper prices).
From 5.5% in 2012, Chile's GDP growth tumbled to 1.9% in 2014 as the domestic market boom faltered along with those copper prices.
A modest rebound in the first half is expected to facilitate overall growth in 2015 of 2.1%; and further improvement to 2.3% is projected for 2016. A weak Chilean peso supports exports, but Chile's major export markets in Asia are unhealthy. Consequently, apart from plywood, panel exports from Chile in 2015 have not surged in response to a weak peso.
Mexico's economic performance has also fallen short of expectations, but has done better than the region as a whole since 2013.
Economic reforms have been slow to benefit the overall economy and falling oil prices have been a barrier to accelerating economic activity in the country. In addition, corruption and political turmoil resulting from the murderous operation of gangs makes it difficult for Mexico to realise its full potential, despite its proximity to the US market. Mexico's economy grew 2.1% in 2014, up from 1.4% in 2013, and is expected to at least match the 2014 pace in 2015. Subsequently, we look for Mexican GDP growth to climb to 2.6% in 2016 as US economic activity rises moderately.
Production and markets: Brazil
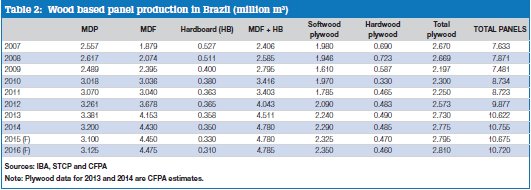
Turning specifically to panel production, the weakness in Brazil's economy in 2014 was reflected in almost no growth in Brazil's production of wood based panels.
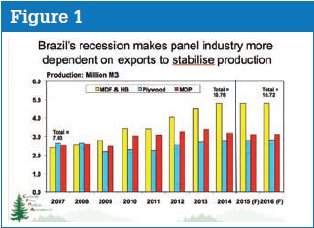
At 10.76 million m3, 2014's production was just 1.3% higher than 2013's 10.62 million m3 (see Table 2). Growth in MDF and plywood output more than offset declines in MDP and hardboard (Figure 1). At 4.43 million m3, Brazil's 2014 MDF production was 6.7% higher than in 2013 and set another new record. Meanwhile, MDP production slipped 5.3% to 3.20 million m3, the lowest level since 2011. Plywood production (softwood and hardwood combined) in 2014 was estimated to have edged up to 2.78 million m3 (also setting a new record), largely because of strong softwood plywood exports to Europe and North America.
With weaker domestic markets in 2015 as recession bites hard, the only positive for Brazil's panel producers is export. Nevertheless, total panel production in 2015 and 2016 is expected to drop, and remain below 2014 levels, largely because of very weak domestic demand.
Unlike the plywood sector, which has been oriented to export markets in Europe and North America for many years, Brazil's MDF and MDP producers have not traditionally had much exposure to exports. This largely reflected the rapid growth in domestic demand over the past decade; producers had a hard time keeping up and therefore had no need to look to exports to maintain high operating rates. That situation has changed rapidly over the past three years as significant new capacity has come on stream as the domestic market has tumbled into recession.
However, while Brazil's plywood manufacturers have an established distribution network in export markets, Brazil's MDF and MDP producers have needed to build one.
At the same time, neighbouring South American countries are also looking to expand their export markets within South America and outside the region, thus increasing competitive pressures in those markets.
Despite these pressures, Chilean-owned mills in Brazil (Arauco and Masisa), together with Brazilian based companies such as Duratex and Berneck, have developed the experience and supplied the resources to increase their export businesses.
It is unlikely that exports alone will be the salvation of the Brazilian panel industry; growing domestic markets will be key to absorbing production from its still-expanding capacity.
MDP capacity in Brazil jumped 35% in 2012- 15, but 2015 production is expected to be little different from 2011. Therefore, MDP production/ capacity ratios in Brazil fell from 89% in 2012-13 to 73% in 2014 and will average just 63% in 2015. Meanwhile, Brazil's MDF capacity jumped 37% in 2012-15, and production/capacity ratios consequently tumbled from 76% in 2012 to 71% in 2013-14 and will average just 67% in 2015.
With further capacity expansion in the pipeline in 2016-17, these average operating rates are likely to either remain low, or to drop still lower, until such time as domestic demand recovers significantly - unlikely before 2017. In the meantime, the downward pressure on operating rates, prices and profitability will likely lead to significant downtime - and possible permanent closures - of older and higher-cost capacity. However, at this point, there are no announcements of mill closures.
Production and markets: Chile
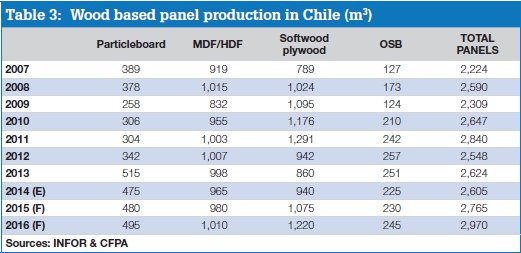
Following on the destruction of the Arauco plywood mill in Nueva Aldea in a wildfire at the end of 2011, Chile's plywood production tumbled, dragging down total panel production in Chile from a record 2.84 million m3 in 2011 to 2.55 million m3 in 2012 (see Table 3).
The rebuilding of the Arauco mill, plus the expansion by CMPC of its plywood operation, increased Chile's plywood capacity. However, plywood production was slow to grow in response to this capacity expansion as technical difficulties hampered the full utilisation of the country's plywood capacity.
Plywood production fell again in 2013 (to 860,000m3 from 942,000m3 in 2012 and 1.29 million m3 in 2011), but is estimated to have grown in 2014 to 940,000m3, largely because of increased exports.
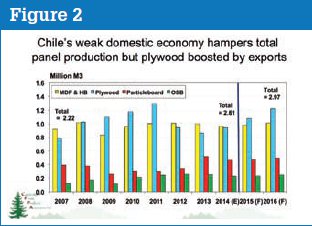
Nevertheless, domestic economic weakness dragged total panel production lower in 2014. At an estimated 2.61 million m3, panel production in 2014 was 1% below 2013 and more than 8% off the 2011 record (Figure 2).
Growing exports of plywood, plus steady domestic demand for MDF and MDP, is expected to allow total panel production to climb 6% in 2015 to 2.77 million m3 and to rise another 7% in 2016, as both export and domestic markets again grow. Consequently, 2016 will set a new record for Chile's total panel production, even though plywood output of 1.22 million m3 (41% of total panel production) will still be below the 2011 high of 1.29 million m3.
Production and consumption: Mexico
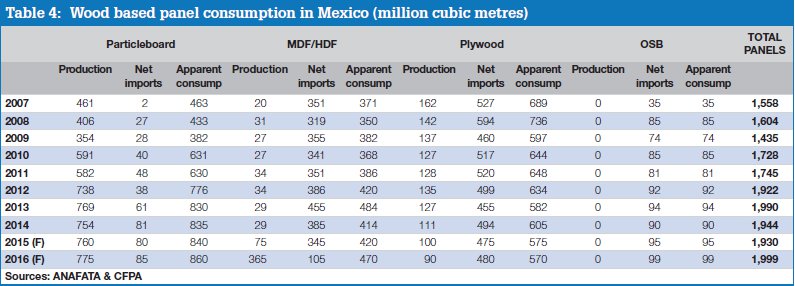
Despite somewhat faster economic growth in 2014 than 2013, Mexico's apparent consumption of panels (production + imports - exports) fell 2.3%, to 1.94 million m3 from 1.99 million m3 (see Table 4). A surprising drop in MDF apparent consumption (from 484,000m3 in 2013 to 414,000m3 in 2014), drove the total lower. This "drop" may reflect data problems - particularly the classification of imports. However, both particleboard and plywood consumption edged higher in 2014.
The pattern of flat-to-lower Mexican panel consumption is likely to be repeated in 2015. The forecast looks for total panel consumption to slip another 1%, given the reported import data we have examined for the first half of 2015.
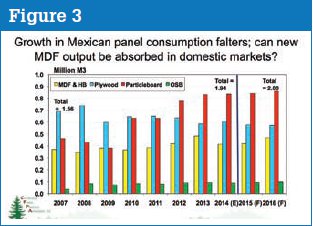
However, given the relative optimism of our macro-economic forecast for Mexico, we look for panel consumption to climb 3.6% to two million m3 in 2016 (see Figure 3).
Domestic MDF production will ramp up as three new mills start operating in 2015-16. The future size of Mexico's MDF/HDF market is a particular concern for the three companies simultaneously building these new MDF mills.
Between them, Masisa, Duraplay and PROteak will add approximately 680,000m3 of capacity to Mexico's fibreboard capacity base of 50,000m3. The forecast presented here shows a small jump in Mexican MDF/HDF production in 2015 on the assumption that at least one of the three new operations will have started up before the year's end. However, the biggest production increases will occur in 2016-17 as the three mills ramp up production.
Significant, if not total, displacement of imported MDF/HDF panels is to be expected. Potentially, Mexico will also become a net exporter of MDF/HDF, particularly to the US, where Mexican products could displace imports from other sources. However, as we noted last year, perhaps the single most interesting unanswered question is whether the availability of a significant supply of MDF/HDF will help boost domestic flat panel furniture output in Mexico, thus providing additional support to the 'on-shoring' of furniture production into North America from Asia