Dreams or nightmares?
17 July 2014Panel markets hit another rough patch in early 2014. The question is whether this was due to the severe winter weather in parts of North America, or to structural impediments to growth. Bernard Fuller, of Cambridge Forest Products Associates, sets out to answer this question
One year ago, following a robust start, expectations for the US housing market were relatively positive and the forecast which WBPI published at that time for 2013-15 - along with those of most analysts - turned out to be optimistic.
The anticipated growth in 2013 was largely not forthcoming and US housing starts for the year were disappointing, falling short of our early-2013 expectations by 13% (actual starts of 0.925 million, versus a forecast of 1.06 million). Nevertheless, US housing starts in 2013 were still 18% higher than 2012, but compared with levels in the 20 years to the middle of the last decade, 2013 US starts were still very low.
Weakness in employment and income growth, a cold and wet spring, plus an upward move in mortgage rates after mid-2013 (in anticipation of the end of US Federal Reserve monetary easing), were the major reasons for this below-expectations performance.
However, also factoring into the disappointment was a relatively mild winter early in 2013 which allowed builders to start projects before the spring, and this boost to actual starts was magnified by large seasonal adjustment factors that seemed to show a healthier housing market than was the case. Once spring arrived, we witnessed monthly housing starts (seasonally adjusted) moving lower until the fourth quarter of 2013, when a significant upward tilt returned to the data.
In turn, the positive news late in 2013 resulted in renewed cautious optimism for the following year. Then North America ran into one of the severest winters in a generation. Construction activity and the transportation networks were hit by deep snow and freezing conditions and the housing reports in the first two months of 2014 were thus disappointing.
However, it is not completely clear that the housing weakness in the first quarter was purely weather-related. Some would argue the weakness reflects more fundamental structural weakness in US housing markets related to affordability: slow growth in employment and the health of US consumers' bank accounts.
Extrapolating first quarter housing data through the whole of 2014 would suggest little or no growth in total US housing starts compared with 2013. However, multiple signs of rebounding economic health, which showed up in March and April data (eg in industrial production), suggest that weather was indeed a major factor in the poor overall economic performance of the US economy in Q1, 2014.
Consequently, we continue to look for further growth in US housing starts in 2014, but the CFPA outlook is more cautious than last year's, given the knuckle-wrapping we had in 2013! For the whole of 2014, the CFPA forecast calls for a modest 14% increase in total US housing starts, to 1.05 million.
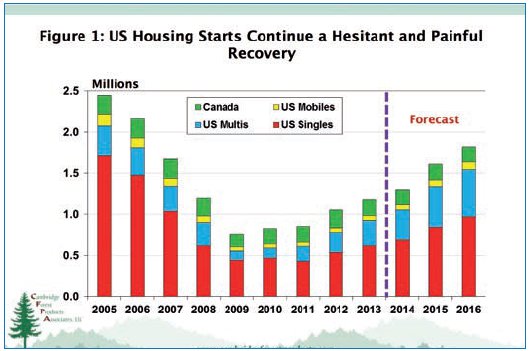
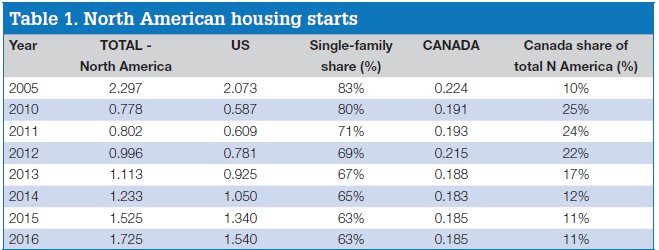
The consensus expectation is for moderate acceleration in the overall economy in the second half of 2014, carrying over into 2015. The CFPA housing forecast therefore looks for a substantial, 28%, jump in US housing starts to 1.34 million in 2015, to be followed by another 15% increase, to 1.54 million units, in 2016, at which point US housing starts will be at, or slightly above, the underlying demand levels for new homes (Table 1 and Figure 1).
In addition, mobile home production in the US will add a further 70-100,000 units per year to new home supply. As a result, 2016 home production in the US will be approximately 1.64 million units, representing the first year in the decade when housing supply exceeds underlying demand (defined as the sum of new household formations plus home replacements).
Meanwhile, Canadian housing starts in 2013 out-performed our early-2013 expectations. Unlike the US, Canadian starts strengthened after the first quarter and for the whole of 2013: 188,000 starts were recorded in Canada. This represented a drop of 13% from 2012, but was comparable to the previous two years (2010-11).
Early-2014 witnessed another bout of surprising weakness in Canadian starts, particularly in March, and it remains to be seen whether this is a temporary aberration or a warning of greater systemic weakness.
For the whole of 2014, the CFPA forecast calls for Canadian starts to slip 3% from 2013, to 183,000; and to hold close to that level in the following two years (Table 1).
Total North American conventional housing production has climbed every year since 2008 and reached 1.113 million in 2013 - a 12% increase over 2012 and 43% up on 2010. Given the respective US and Canadian housing projections, this total will rise another 11% in 2014, to 1.233 million; 24% in 2015 to 1.525 million; and another 13% in 2016 to 1.725 million units (still 25% below 2005).
Given the hesitant nature of the housing recovery over the past five years, this projection has to be classified as relatively optimistic.
Canadian starts could easily average 10% lower than projected over the next three years, while US starts may never match underlying demand through the rest of the decade, as limited increases in incomes, and growing income and wealth inequalities, limit the ability of US families to form their own separate households. Growing economic inequality could constitute the most significant structural impediment to the post-recession recovery in US housing markets. Furthermore, systemic inequality would underpin a major structural shift in the US housing market for generations to come. If so, then all the current assumptions about the long-term potential for the US housing market would need to be modified significantly.
Other major markets for panels While new home construction is the single largest end-use sector to consider for the North American panel industry's potential, there are other end-uses which impinge on the sector, contributing significantly to overall demand.
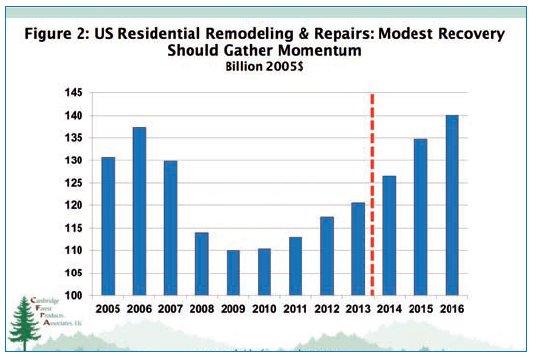
Two other end-use markets that should be closely tracked are residential repair and remodelling (R&R); and furniture production. US R&R constant dollar expenditures in 2013 were at their highest levels since 2007, but were still well below the 2005-7 average of US$132.5bn (Figure 2). If Americans can't afford new homes, it is reasonable to expect that more attention will be paid to maintaining and upgrading existing structures (as in Europe).
These R&R expenditures in the US are projected to climb 5% in 2014, 6% in 2015 and 4% in 2016, to US$140.1bn, to set a new post-2005 record. This growth should support increased consumption of panels in home additions (particularly OSB and plywood) and in cabinets, flooring, mouldings, etc.
US furniture production remains the single largest end-use market for particleboard and MDF/HDF. The US furniture industry contracted sharply after the late 1990s, first because of import competition and substitution (largely by Chinese-manufactured furniture) and second because of the impacts of the Great Recession.
The massive substitution of imports for domestically produced furniture has largely run its course. Furniture import growth has only slightly exceeded that of domestic production in recent years and new furniture plants are again being built in North America to take advantage of shorter distances to markets; and more competitive costs as wage levels in China rise.
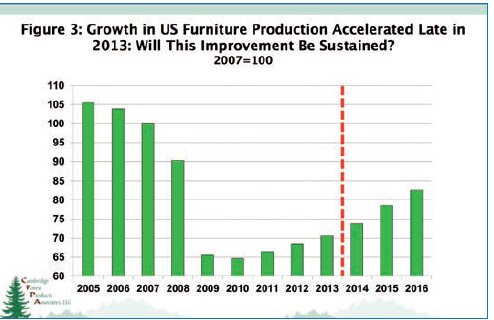
US furniture production increased 3.2% in 2013 and was 9% above its 2010 cyclical low (Figure 3). The forecast calls for 4.5% growth in 2014, to be followed by +6.5% in 2015 and another +5% in 2016. Despite this relatively aggressive growth path, US furniture output in 2016 would still be 22% below its 2005 peak.
Recent market developments
Slower-than-expected growth in housing, together with increased capacity (particularly in OSB), as well as rising imports (especially of MDF/HDF), combined to end the late-2012 and early-2013 leap in commodity panel prices.
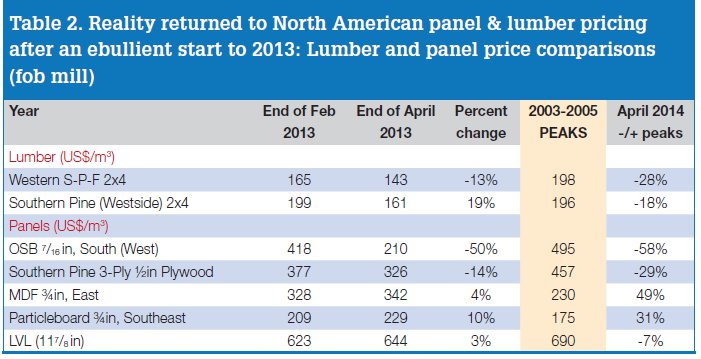
By mid-2013, markets had either slumped (eg OSB and plywood), or were struggling to move sideways through the rest of the year (eg MDF/ HDF and particleboard). Table 2 illustrates the movements of representative panel prices from their 2013 peaks (around end-February 2013) through the end of April 2014 and compares these prices to the previous cycle peaks (2003-5).
Clearly, commodity lumber and structural panel prices had a major roller-coaster ride. In contrast, industrial and speciality products, such as particleboard, MDF/HDF and LVL, saw an upward tilt, with modest price swings at most.
In contrast to the disappointing 2013 housing story, growth in furniture production was moderately healthy in 2013 and this boosted particleboard demand, particularly late in the year. Year-end 2013, and early 2014, announcements of North American particleboard mill closures (three operations in British Columbia, Oregon and Georgia) have reduced North American particleboard capacity by approximately 7% and consequently the market position of particleboard producers has been bolstered. However, the full benefits of these closures will likely not be realised before the second half of 2014 and into 2015.
However, MDF/HDF markets lost momentum after mid-2013 and struggled to hold price levels, even as year-on-year North American MDF/HDF production dropped in the fourth quarter of 2013 and early in 2014.
A 15% surge in US offshore imports of MDF/ HDF in 2013, led by a 37% jump in volumes from Chile, loosened up markets that were previously very tight, late in 2012 and early in 2013.
In addition, MDF/HDF effective operating capacity climbed as operating mills raised production closer to rated capacity.
Lastly, it seems that MDF may have lost market share to lower-priced particleboard (and perhaps other products) in those applications where they are relatively easily inter-changed. As of the end of April 2014, US MDF prices (fob mill) commanded a 49% premium over particleboard. This compares to a 31% premium back around mid-decade (see Table 2).
For oems looking to control costs, this price difference is sufficient to encourage the use of materials and production technologies which result in lower unit costs - even if that means substituting a panel (particleboard) for an otherwise-preferred product such as MDF.
OSB was both the most exhilarating and the most frustrating panel product over the 18 months beginning in the autumn of 2012. As of the end of April 2014, OSB prices were 50% below February 2013 peaks and had been soft through much of the first four months of 2014 as construction markets struggled to thaw.
However, late April/early May saw the beginning of a recovery in OSB prices as construction-related consumption finally picked up. Possibly this upswing means the beginning of a sustained rally that will continue through the summer of 2014. While weather-related issues throttled OSB consumption in the first quarter of 2014, the bigger brake on pricing was the increase in operating capacity over the past two years.
Mothballed capacity which was re-opened in anticipation of a sustained recovery in US housing starts has in fact outstripped the growth in demand, thus dampening pricing.
In the first quarter of 2014, OSB production was up 8% over the same period in 2013, even though US housing starts in the same period were 4% lower.
The surge in OSB production in the face of weak growth in residential construction also hit softwood plywood producers. Plywood prices did not tumble as much as those for OSB for three reasons:
- Higher plywood manufacturing costs than for OSB always fix minimum plywood prices at relatively high levels vis-à-vis OSB
- OSB prices by February 2013 had soared to an unusual premium over plywood; when OSB prices broke, they tumbled to re-establish their 'normal' discount to plywood, as well as dropping close to OSB cost floors (levels significantly lower than those for plywood)
- Lastly, in an effort to support plywood prices, producers cut production. Q1 2014 North American plywood production was 5% below the same period in 2013.
Increased plywood imports also factored into domestic production decisions. For 2014, there is considerable concern about increased imports from South America. Chilean exports of sanded and high-quality sheathing plywood are expected to climb as two large new lines ramp-up production. Also, Brazilian producers will likely take advantage of a weaker currency to ship more commodity sheathing to North America.
Looking forward
Driving the CFPA forecast for North American panel consumption are the assumptions made about the level and mix of housing starts (single family, multi-family and mobile homes); the growth in R&R expenditures; and the competitive health of North American furniture producers in helping to meet strengthening North American demand over the next several years.
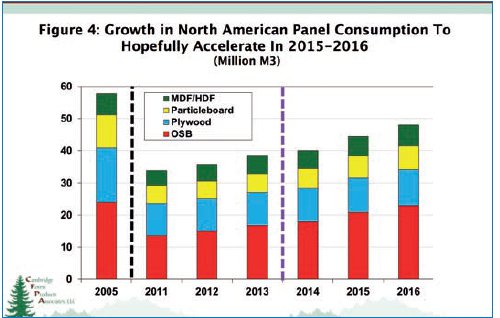
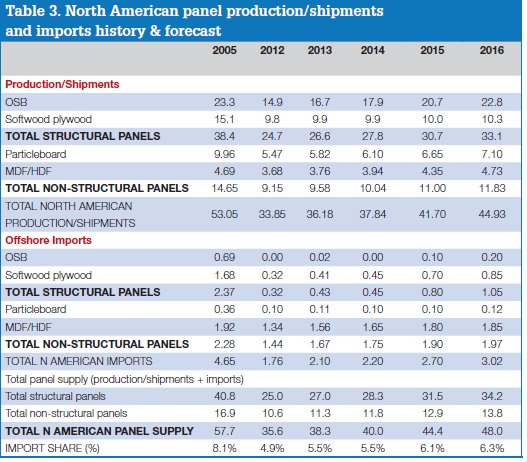
Total North American panel apparent consumption is forecast to climb from 38.3 million m3 in 2013 to 40.0 million m3 in 2014 and to reach 48.0 million m3 by 2016 (an increase of 25% over three years).
Import volumes will climb from 2.1 million m3 in 2013 to over three million m3 in 2016 and the import share of total supply will edge up from 5.5 to 6.3%. Nevertheless, domestic North American production will climb well over eight million m3 in 2013-16, rising from 36.2 million m3 to 44.9 million m3 (Table 3).
OSB will continue to be the volume leader over the next three years of recovery, just as it was over the past three years. Production is expected to jump 37% from 2013 levels to 22.8 million m3 in 2016, still 2% below its 2005 peak.
In contrast, North American plywood production will see a much smaller increase of just 4%, to 10.3 million m3, while plywood imports are forecast to more than double. Consequently, the OSB share of the North American structural panel market will climb from 62% in 2013 to 67% by 2016.
Turning to non-structural panels, North American production of both particleboard and MDF/HDF will grow by similar margins; 26% for MDF/HDF and 22% for particleboard. The reopening of the Pembroke, Ontario MDF mill after mid-2014 will facilitate the forecast growth in total North American MDF/HDF production.
In contrast, no new particleboard capacity is anticipated over the next three years and additional closures of older capacity would not be a surprise. However, the combination of rising demand and flat-to-lower capacity will boost particleboard operating rates close to those for MDF/HDF by 2015. Consequently, particleboard pricing will likely rise faster than MDF/HDF, narrowing the spread between respective prices to more 'normal' ranges. This will bring particleboard profitability more in line with that for MDF/HDF in North America.
Rising MDF/HDF imports, together with increased domestic operating capacity, will hamper domestic MDF/HDF producers from raising prices. (The forecast calls for a 19% increase in North American MDF/HDF imports between 2013-16, from 1.56 million m3 to 1.85 million m3.) However, sharply rising domestic particleboard prices could also boost imports from offshore, particularly if the US dollar exchange is relatively strong.
In addition, faster increases in particleboard than MDF prices could lead to substitution of MDF for particleboard, dampening particleboard demand growth and boosting that of MDF. Meanwhile, the opening of three new MDF mills in Mexico in 2015 will likely displace US exports to Mexico, with the possibility of significant US MDF imports from Mexico (starting 2016) further dampening North American pricing, unless demand growth in the US and Canada is stronger than anticipated.
Figure 4 illustrates the overall outlook for North American panel consumption, particularly the acceleration in growth in 2015-16. Because of the strength in the housing projections discussed earlier, it would be correct to assume that these panel consumption and production predictions are also relatively optimistic.
However, we would attribute a probability of at least 50% to this overall outcome and there is potential for an upside outcome if US GDP was to grow faster than 3% per year for a couple of years.
Not all our dreams have to turn into Nightmares.